> ## Documentation Index
> Fetch the complete documentation index at: https://www.mintlify.com/docs/llms.txt
> Use this file to discover all available pages before exploring further.
# Analytics overview
> Explore the Mintlify analytics dashboard to measure documentation traffic, assistant conversations, search queries, engagement, and reader feedback.
Analytics require a [Pro or Enterprise plan](https://mintlify.com/pricing?ref=analytics).
The [analytics](https://app.mintlify.com/analytics) page in your dashboard shows how visitors find and use your documentation. Use these signals to identify valuable pages, discover content gaps, and track changes over time.
Analytics data typically appears within a few minutes of an interaction. Very recent events might not appear immediately.
## Select an analytics view
Track visitors, page views, referrals, and human and agent traffic.
Review assistant usage, conversation topics, satisfaction, and transcripts.
Analyze search volume, frequent queries, and click-through rates.
Understand content actions, navigation paths, and search and assistant funnels.
View feedback over time, review specific ratings and written feedback, and track follow-up work.
Export dashboard data to CSV for analysis, reporting, or archival.
Send analytics events to Amazon S3 for downstream processing.
## Filter by time period
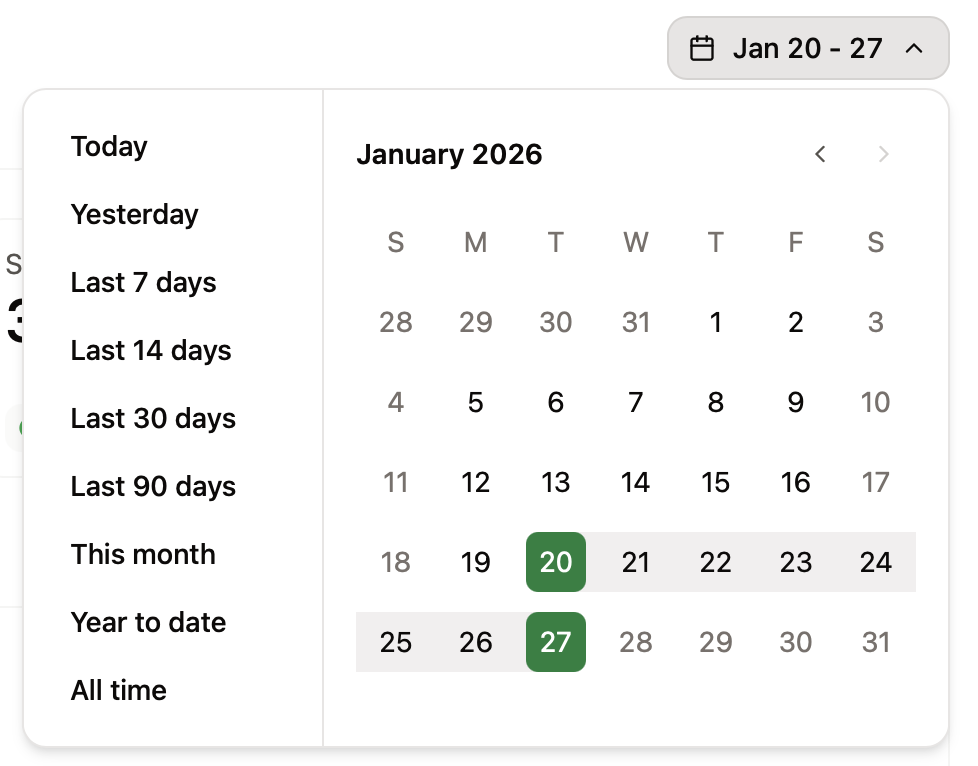
Use the range selector in an analytics view to adjust the time period for the displayed data. Exports also use the selected time range.
 ## Related topics
- [Analytics overview](/docs/analytics/index.md)
- [Automations overview](/docs/automations/index.md)
- [Components overview](/docs/components/index.md)
## Related topics
- [Analytics overview](/docs/analytics/index.md)
- [Automations overview](/docs/automations/index.md)
- [Components overview](/docs/components/index.md)