
TeeChart VCL/FMX Samples
Explore 700+ professional code samples demonstrating the full power of TeeChart for Delphi and C++ Builder. From basic charts to advanced 3D visualizations, find the examples you need to build stunning data visualizations.
Quick start
Get up and running with TeeChart samples in just a few steps
Download TeeChart Pro
Open your first sample
- Open
VCL/TeeNew/TeeNew.dprojfor the comprehensive demo with 687 examples - Or browse
VCL/directory for specific feature samples
- Open
FMX/Demo/TeeChart_Pro_Firemonkey_Demo.dprojfor the main demo - Or explore
FMX/StandardSeriesDemo/for chart type examples
Choose your framework
TeeChart supports both VCL and FireMonkey frameworks for maximum flexibility
VCL Framework
Visual Component Library
Native Windows UI framework with 687 comprehensive examples in the TeeNew demo. Includes financial charts, gauges, maps, and advanced 3D visualizations.
FireMonkey
Cross-Platform Framework
Build once, deploy to Windows, macOS, iOS, and Android. Features animations, dashboards, and responsive charts that adapt to any screen size.
70+ chart types
From standard charts to specialized visualizations for every use case
Area charts
Bar charts
Line charts
Pie charts
Bubble charts
Gantt charts
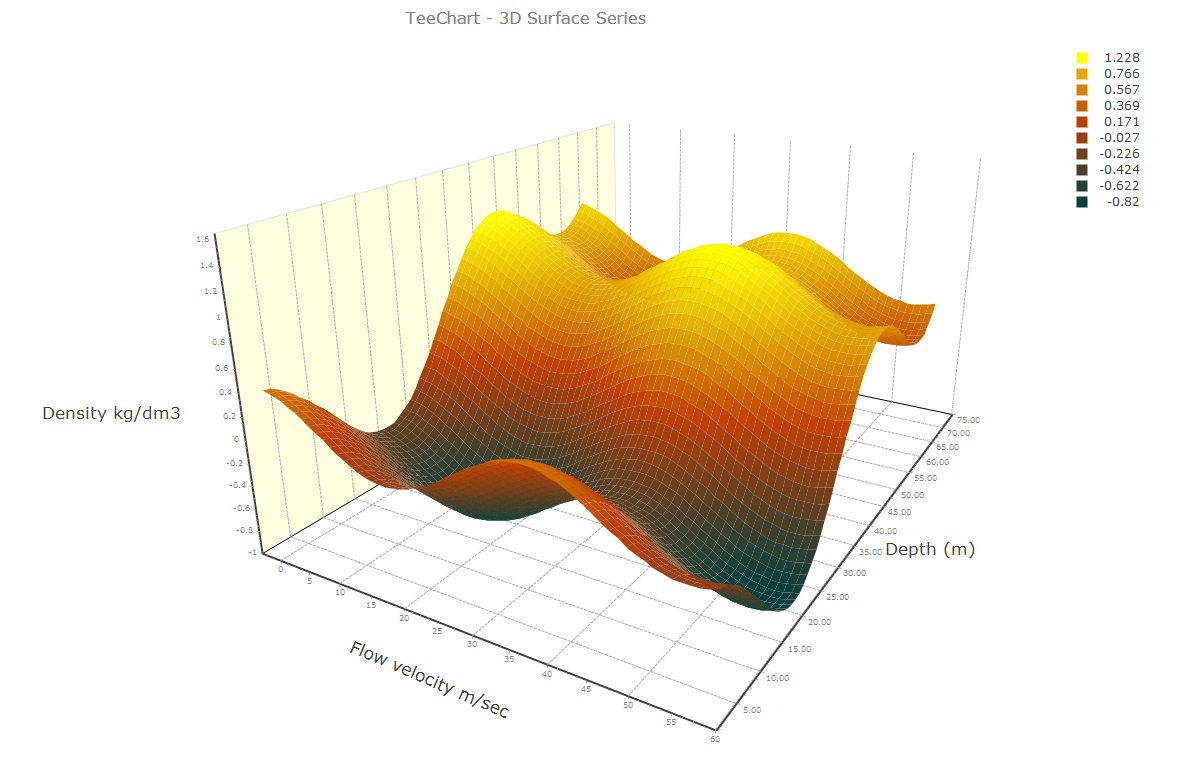
Surface charts
Contour charts
Powerful features
Everything you need to create professional data visualizations
Axes & Scaling
Legends & Annotations
Real-time Data
Database Integration
Export Formats
Interactive Tools
Featured demos
Complete applications showcasing TeeChart capabilities
TeeNew Demo
FMX Demo
TeeMaker
Ready to start building?
Download TeeChart Pro and explore all samples. Get support and connect with the Steema community.