
Welcome to TeeChart VCL/FMX Samples
This repository contains a comprehensive collection of over 700 professional code samples demonstrating the full capabilities of TeeChart Pro VCL/FMX - the industry-leading charting component library for RAD Studio, Delphi, and C++ Builder.What is TeeChart VCL/FMX?
TeeChart Pro VCL/FMX is a powerful charting and data visualization component library that enables you to create general purpose and specialized chart and graphing applications for all areas including:Business & Financial
Create professional business dashboards, financial reports, and interactive data visualizations
Scientific & Statistical
Build advanced scientific plots, statistical analysis tools, and research visualizations
Real-time Monitoring
Develop live data monitoring systems, sensor dashboards, and streaming analytics
Cross-platform Applications
Deploy to Windows, macOS, iOS, Android, and Linux using FireMonkey framework
Chart Gallery
TeeChart offers an extensive chart gallery with over 70 chart types with both 2D and 3D views:- Standard Charts: Bar, Line, Area, Point, Pie, Donut, Bubble
- Financial Charts: Candle, OHLC, Volume, Point & Figure
- Statistical Charts: Box Plot, Histogram, Error Bar, Error Point
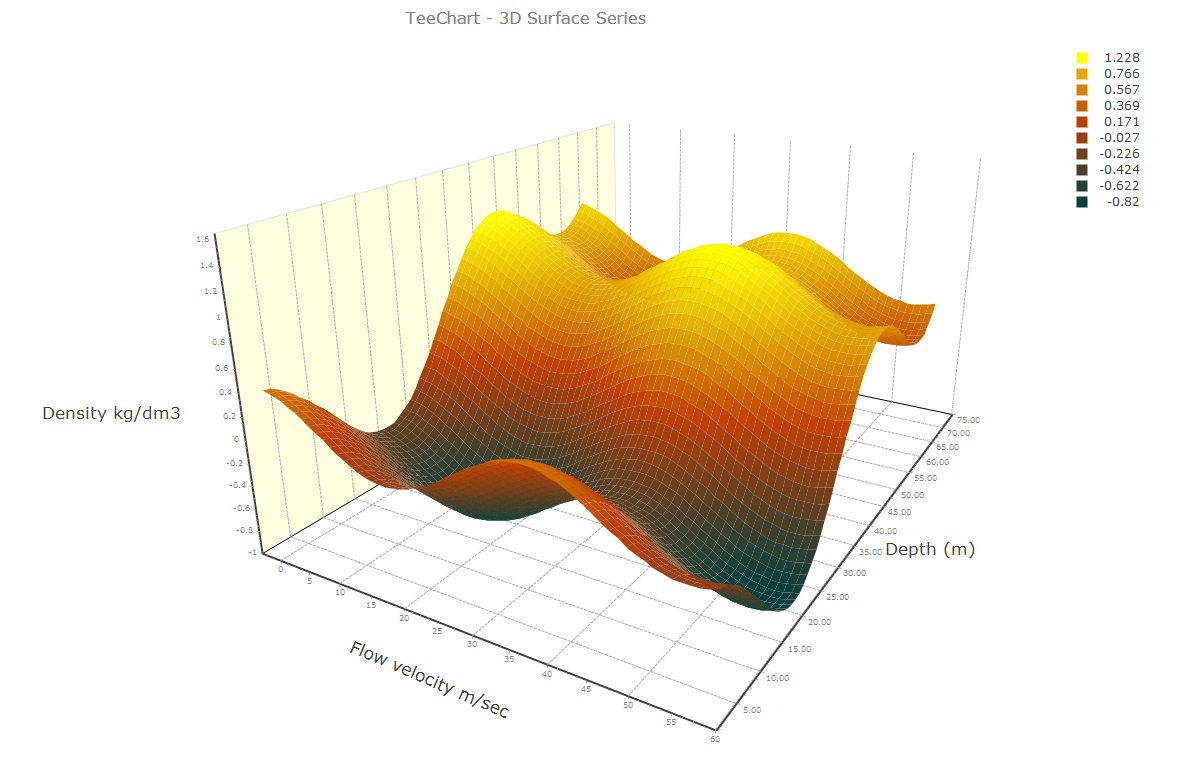
- 3D Charts: Surface, Contour, Tower, Point3D, Line3D
- Specialized Charts: Gantt, Polar, Radar, Smith, Calendar
- Gauges & Maps: Circular Gauge, Linear Gauge, Knob, Digital Gauge, World Maps
What This Repository Contains
This samples repository is organized into two main frameworks:VCL Samples (Windows)
Located in theVCL/ directory, these samples demonstrate TeeChart for traditional Windows VCL applications:
- TeeNew: The flagship demo with 687+ working examples showcasing most of TeeChart VCL functionality
- TeeMaker: Advanced 3D chart creation and manipulation samples
- TeeChartOffice: Professional office-style chart applications
- Maps: Geographic mapping samples with world, regional, and specialized maps
- ActivityGauge: Custom gauge implementations using Donut series
- Real-time Data: Ring buffer and streaming data examples
- Database Integration: DBChart samples with data aggregation
FMX Samples (Cross-platform)
Located in theFMX/ directory, these samples demonstrate TeeChart for FireMonkey cross-platform applications:
- Demo: Comprehensive FireMonkey demos for desktop and mobile
- StandardSeriesDemo: Multi-view dashboard demonstrating standard series types
- Dashboard: Professional dashboard with charts, grids, and maps
- Using Gauges: Complete gauge implementation examples
- ActivityGaugeSeries: Animated activity gauges for FMX
- LiveBindings: Integration with FireMonkey LiveBindings
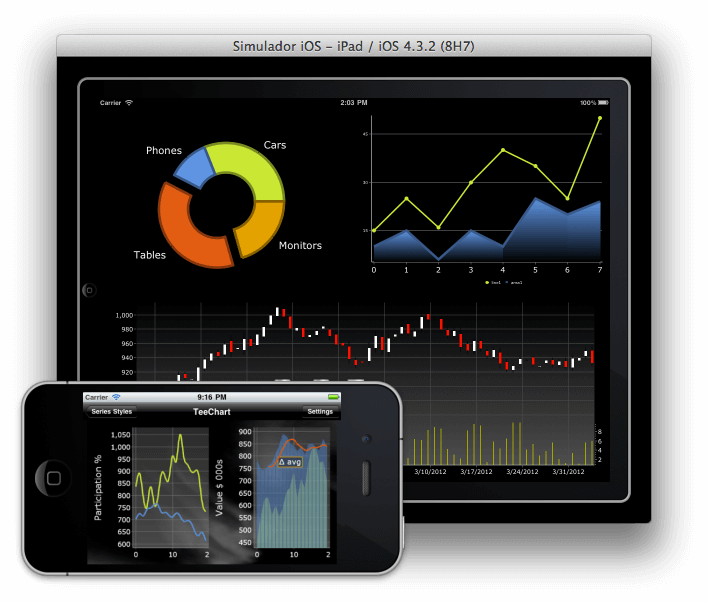
- Cross-platform: Samples running on Windows, macOS, iOS, and Android
Key Features Demonstrated
These samples cover the complete feature set of TeeChart:Chart Types & Series
Chart Types & Series
Examples of all 70+ chart types, from simple line charts to complex 3D surfaces. Learn how to configure, style, and customize each series type for your specific needs.
Data Management
Data Management
Database connectivity, real-time data streaming, data aggregation, custom data sources, and efficient handling of large datasets.
Interactivity
Interactivity
Zooming, panning, drill-down, cross-hair tools, cursor tools, chart linking, and event handling for user interactions.
Customization
Customization
Custom drawing, OpenGL rendering, themes, gradients, patterns, backgrounds, and complete visual customization.
Export & Output
Export & Output
Export to image formats (PNG, JPEG, BMP, GIF), PDF, SVG, HTML5/Canvas, and clipboard operations.
3D Visualization
3D Visualization
3D rotation, lighting, textures, orthogonal/perspective views, and advanced 3D chart types.
Learning Path
We recommend exploring the samples in this order:Start with Basic Examples
Begin with simple chart types in the VCL or FMX demo applications to understand the fundamentals of creating and configuring charts.
Explore Chart Types
Review the StandardSeriesDemo (FMX) or TeeNew (VCL) to see all available chart types and their use cases.
Study Feature Samples
Dive into specific feature samples like real-time data, database integration, or export functionality.
Why TeeChart?
TeeChart has been trusted by over 22,000 organizations across 140 countries since 1996:- Proven Reliability: Battle-tested in mission-critical applications across multiple industries
- Comprehensive Documentation: Extensive samples, tutorials, and API documentation
- Active Development: Regular updates with new features and platform support
- Professional Support: Direct access to Steema’s expert support team
- Cross-platform: Single codebase for Windows, macOS, iOS, Android, and Linux
Other Steema Libraries
TeeChart works seamlessly with other Steema component libraries:- TeeGrid - Fast, lightweight grid component for data display
- TeeBI - Business Intelligence and data analysis framework
- TeeTree - Tree and organizational chart components
Next Steps
Quick Start
Download TeeChart and run your first sample in minutes
Requirements
System requirements and supported IDE versions
VCL Samples
Explore Windows VCL sample applications
FMX Samples
Browse cross-platform FireMonkey samples
Need Help? Visit the Steema Support page for questions, bug reports, or feature requests.
About Steema
Founded in 1996 and based in Girona, Catalonia (Spain), Steema Software SL is dedicated to the development of software component libraries for developers, chiefly charting and data-visualization products. Steema’s component libraries are used by more than 22,000 organizations across 140 countries in a variety of conventional and non-conventional sectors, including scientific, financial, business, industrial, sport, and marketing. Website: https://www.steema.com/Email: [email protected]