
Console Access

The browser console provides access to powerful debugging tools and global variables.

Opening the Console

1

Desktop: F12 Key

Press F12 to open browser developer tools and access the console.
2

Mobile: #dev URL

Type #dev in the browser address bar. The page won’t reload, and you’ll see a button to open the console.

Advanced Settings

Many settings are not exposed in the UI but can be accessed via the console.

Viewing Settings

// Display all options
options

// View changed settings only
debugChangedOptions

Modifying Settings

// Change render distance
options.renderDistance = 8

// Enable smooth lighting
options.smoothLighting = true

// Change FOV
options.fov = 90

// Enable debug packet logging (non-frequent packets only)
options.debugLogNotFrequentPackets = true
Settings changed via console persist in localStorage. Some changes may require reconnecting or reloading.

Debug Variables

The console exposes several global variables for debugging and inspection:

Core Variables

// Mineflayer bot instance
bot

// Three.js world renderer instance
world

// Local server instance (singleplayer only)
localServer
server // alias for localServer

// NBT utilities
nbt.simplify(someNbt) // Simplifies NBT data for easier reading

Debug Helpers

// Toggle all debug messages
debugToggle // Get current state and toggle
debugToggle = 'minecraft-protocol' // Enable specific namespace

// View top packet statistics
JSON.stringify(debugTopPackets)

// Packet name references
debugServerPacketNames // All server->client packet names
debugClientPacketNames // All client->server packet names

World Inspection

// Get all loaded chunk sections
world.sectionObjects

// Relative to current position (0,0 is current chunk)
debugSceneChunks

// Helper functions for chunk/section keys
chunkKey(xRel, zRel) // e.g., chunkKey(0, 1)
sectionKey(xRel, yRel, zRel) // e.g., sectionKey(1, 0, -1)

// Get camera position
world.getCameraPosition()

Block Inspection

// Get block at cursor
cursorBlockRel(x, y, z) // With offset from cursor
cursorBlockRel() // Block at cursor

// Get entity at cursor
entityCursor()

// Holding block
holdingBlock

Singleplayer Server Variables

// View all loaded regions
localServer.overworld.storageProvider.regions

// Change world name
localServer.levelData.LevelName = 'MyWorld'
localServer.writeLevelDat()

Packet Logging

Enable Debug Logging

// Enable ALL debug messages (WARNING: causes packet spam!)
debugToggle

// Recommended: Log only non-frequent packets
options.debugLogNotFrequentPackets = true

// View packet statistics
JSON.stringify(debugTopPackets)

Inspect Specific Packets

// Inspect server packets
inspectPacket('position', false, true) // Full packet data
inspectPacket('position') // First argument only

// Inspect client packets
inspectPacket('position', true)

// Use wildcards
inspectPacket('entity_*') // All entity packets

// Custom listener
inspectPacket('chat', (data, name) => {
  console.log('Chat message:', data.message)
})

// Detach listener
const listener = inspectPacket('position')
listener.detach // Remove listener

Packet Recording and Replay

1

Enable Recording

Go to Settings → Advanced → Enable Packets Replay
2

Play the Game

Connect to a server and perform actions you want to debug.
3

Download Recording

Use the export function or check the download folder for the replay file.
4

Replay Packets

Load the replay file:
?replayFileUrl=<url_to_replay_file>
Packet replays are useful for debugging issues that are hard to reproduce or for testing without a live server.

F3 Keybindings

Minecraft-style F3 debug keybindings are available:
KeybindingActionDescription
F3Toggle Debug OverlayShows FPS, position, chunk info
F3 + AReload ChunksReloads all chunks from server
F3 + GToggle Chunk BordersShows chunk section borders with colored outlines

Chunk Border Colors

When chunk borders are enabled (F3 + G):
  • Yellow - World chunk sections
  • Red - Hostile mobs
  • Green - Passive mobs
  • Blue - Players

Watch Expressions

Watch expressions in DevTools automatically re-evaluate in real-time. Watch expression

Useful Watch Expressions

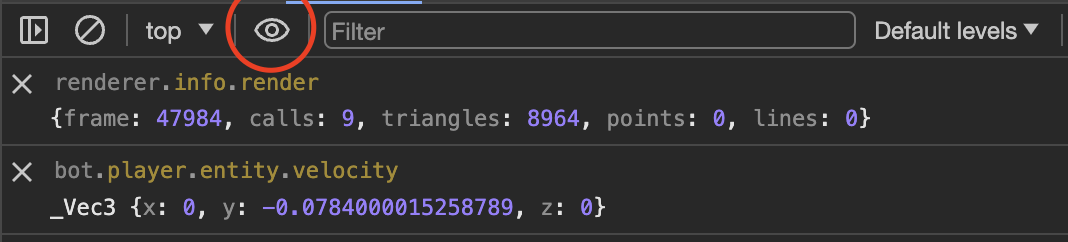
// Camera position (updates continuously)
world.getCameraPosition()

// Current chunk position
`${Math.floor(bot.entity.position.x / 16)}, ${Math.floor(bot.entity.position.z / 16)}`

// Player velocity
bot.entity.velocity

// Current health and food
`HP: ${bot.health} Food: ${bot.food}`

// Loaded chunks count
Object.keys(world.sectionObjects).length

// Memory usage
(performance.memory.usedJSHeapSize / 1024 / 1024).toFixed(2) + ' MB'

Performance Debugging

Performance Metrics

// Request current metrics
requestMetrics()

// Custom performance tracking
markStart('myOperation')
// ... do something ...
markEnd('myOperation')

// View stats per second
statsPerSecAvg

// Add custom counter
addStatPerSec('myCounter')
statsPerSec // View current second's stats

Memory Inspection

// Check memory usage (Chrome only)
performance.memory.usedJSHeapSize / 1024 / 1024 // MB
performance.memory.totalJSHeapSize / 1024 / 1024
performance.memory.jsHeapSizeLimit / 1024 / 1024

File Inspection

NBT Files and Region Files

Drag and drop .dat or .mca (region) files into the browser window to view their contents in the console.

Download Server Files

// Download file from local server (singleplayer)
downloadFile('/world/playerdata/uuid.dat')
downloadFile('level.dat')

Utility Functions

General Helpers

// Object utilities
keys(obj) // Object.keys shorthand
values(obj) // Object.values shorthand
len(obj) // Object.keys(obj).length

// Vector3 constructor
Vec3(x, y, z)

// Clear localStorage (keep specific keys)
clearStorage('serverList', 'options')

Ignore Packets

// Ignore specific packets (stored in sessionStorage)
sessionStorage.ignorePackets = ['keep_alive', 'entity_velocity']

Query Parameters for Debugging

Development Query Parameters

?reconnect=true
Reconnects to the server on page reloads. Very useful for server testing.

Add Artificial Latency

?addPing=100
Adds 100ms to both directions (200ms total to your ping). Useful for testing high-latency scenarios.

Lock Settings

?setting=renderDistance:4&setting=smoothLighting:false
Set and lock specific settings for testing.

React Profiling

To start React profiling:
  1. Disable REACT_APP_PROFILING code first in the source
  2. Open React DevTools
  3. Go to Profiler tab
  4. Click record and perform actions
  5. Analyze component render times

Debugging Tips

VSCode has excellent debugger support. Set breakpoints in your code and step through execution.For faster debugging, use the --no-sources flag to speed up source map parsing.
Some data is cached between restarts. If something doesn’t work after updating dependencies:
rm -rf dist/
Always check the browser console for errors and warnings. Enable verbose logging:
localStorage.debug = '*'
Some issues only appear in production builds. Test with:
pnpm build
pnpm prod-start

Common Debug Scenarios

Debugging Physics Issues

// Watch player position and velocity
bot.entity.position
bot.entity.velocity

// Check if on ground
bot.entity.onGround

// View current control state
bot.controlState

Debugging Rendering Issues

// Check loaded chunks
Object.keys(world.sectionObjects).length

// View specific chunk section
world.sectionObjects['0,64,0'] // x, y, z

// Toggle chunk borders
options.showChunkBorders = true

// Reload all chunks
// Press F3 + A

Debugging Connection Issues

// Enable packet logging
options.debugLogNotFrequentPackets = true

// Check connection state
bot._client.state

// View server info
bot.game

Browser-Specific Issues

Opera Mini

Disable mouse gestures in browser settings to avoid opening a new tab on right-click-and-hold.

Vivaldi

Disable Controls → Raw Input in game settings if experiencing issues:
options.mouseRawInput = false

Remote Debugging (Mobile)

For mobile debugging:
  1. Navigate to yoursite.com/#dev
  2. Click the console button that appears
  3. Use the Eruda console for mobile debugging

Next Steps

Build docs developers (and LLMs) love