10 best AI observability tools for monitoring and evaluating agents in 2026
Harkirat Chahal
Growth
Share this article
Harkirat Chahal
Growth
Share this article
AI observability records how a production agent handles each request and evaluates the quality of its response, exposing failures that standard application logs cannot explain. This guide compares ten tools for tracing agent behavior, evaluating output quality, investigating production failures, and preventing regressions.
AI observability reveals how production agents handle requests and exposes failures that standard application logs cannot explain. This guide helps developers and AI engineering teams compare ten tools for tracing agent behavior, evaluating output quality, investigating production failures, and preventing regressions.
The 10 tools at a glance
1. Braintrust: Best overall for unified production tracing, evaluation, human review, and release checks.
2. Arize AX and Phoenix: Best for OpenTelemetry-native observability with managed and open-source options.
3. Raindrop.ai: Best for detecting production agent behavior issues and validating fixes through experiments.
4. Maxim AI: Best for combining agent simulation, evaluation, tracing, and production monitoring.
5. Galileo AI, now Splunk Agent Observability: Best for continuous production evaluation and runtime guardrails at scale.
6. PromptLayer: Best for prompt-centric observability, agent tracing, datasets, and evaluation workflows.
7. Evidently AI: Best for open-source evaluation and monitoring across LLM applications, agents, and traditional ML systems.
8. Fiddler AI: Best for regulated organizations requiring governance, safety monitoring, and deployment control.
9. Weights & Biases Weave: Best for adding agent tracing and evaluation to an existing W&B stack.
10. LangSmith by LangChain: Best for framework-native tracing and evaluation across LangChain and LangGraph applications.
What AI observability means for production agents
AI observability records how an agent handles each request and evaluates the quality of its response. It captures the model calls, retrieved context, tool activity, intermediate steps, and final output needed to investigate failures that standard application logs cannot explain.
Traces: A trace records the complete path of one request, including every model call, tool call, retrieval step, and final response in execution order.
Spans: A span represents one operation within a trace. Each span contains its own input, output, duration, and metadata. Parent-child relationships between spans show how the agent moved through a multi-step task.
Sessions: A session groups traces from the same interaction. A five-turn support conversation, for example, contains five traces within one session.
Scores: A score measures the quality of a trace or span. It may come from a deterministic rule, an LLM-based evaluator, or a human reviewer.
AI observability vs. LLM monitoring vs. traditional APM
Production AI systems often use traditional APM, LLM monitoring, and AI observability together because each one reveals a different type of failure.
Traditional APM tracks application and infrastructure health through metrics such as CPU usage, memory consumption, request volume, error rates, and response times, and flags the moment a service or dependency goes down or slows.
LLM monitoring covers model traffic, including token usage, cost, latency, provider errors, and failure rates, so teams can see how model calls perform and what they spend.
AI observability examines agent behavior and output quality. It shows which tools the agent selected, what context it retrieved, how it moved through the task, and how accurately it answered the request.
Core signals to capture in production
Diagnosing an agent failure requires signals that cover execution, quality, performance, cost, and user experience.
Agent traces preserve every step in execution order, including parent-child relationships between model calls, retrieval operations, and tool activity. A complete trace lets reviewers reconstruct the agent's decision path.
Tool calls record the selected tool, submitted arguments, returned result, execution status, and any error details. These fields show if the agent chose the wrong tool, supplied invalid inputs, or received an unusable response.
Latency by span breaks total response time into individual operations. Span-level timing identifies the model, retrieval process, or external API responsible for a slow request.
Token and cost attribution assigns usage and spend to the relevant model, feature, customer, and environment, which makes expensive workflows and sudden usage increases easier to locate.
Error taxonomy separates model, tool, retrieval, validation, and infrastructure failures. Combining them under one error rate hides their causes and makes ownership unclear.
User feedback captures ratings, corrections, escalations, abandoned sessions, and other signals that indicate an unsatisfactory experience.
Evaluation scores measure output quality across production traffic using automated scorers, LLM-based evaluators, and human review. These scores help identify regressions that latency and error metrics cannot detect.
How to evaluate AI observability tools
AI observability tools differ in how they collect traces, evaluate quality, store data, and charge for usage. Compare each product across these seven factors.
Deployment model
Check if the product supports managed cloud, self-hosting, or a hybrid deployment with the data plane inside your cloud account. Data residency and security policies may eliminate some options before feature comparisons begin.
OpenTelemetry support
OpenTelemetry-compatible tools let you instrument applications using a standard format and route traces to multiple backends. Proprietary SDKs may offer quicker setup or deeper product-specific data, but switching providers can require new instrumentation.
Framework coverage
Confirm that the product supports the agent frameworks, model providers, and programming languages in your stack. Native integrations and automatic instrumentation reduce the amount of custom tracing code required.
Setup effort
Compare the time needed to capture the first trace with the work required to instrument a complete multi-step agent. Basic model logging may take minutes, but tool calls, retrieval steps, sessions, and custom metadata often require additional configuration.
Governance
Review SSO, role-based access, audit logs, retention controls, data residency options, and compliance certifications. Confirm that the required controls are available on the plan you intend to use.
Pricing model
Identify what the provider measures, such as seats, traces, spans, stored data, scores, or token usage. One agent request can generate dozens of billable events, so multiply the unit price by your expected monthly volume before comparing entry prices.
Evaluation depth
Look beyond trace collection and confirm support for automated scorers, LLM-based evaluation, human review, online scoring, reusable datasets, and release checks. Products that keep traces and evaluation in one system let a confirmed failure become a regression test without exporting data.
The 10 best AI observability tools in 2026
1. Braintrust
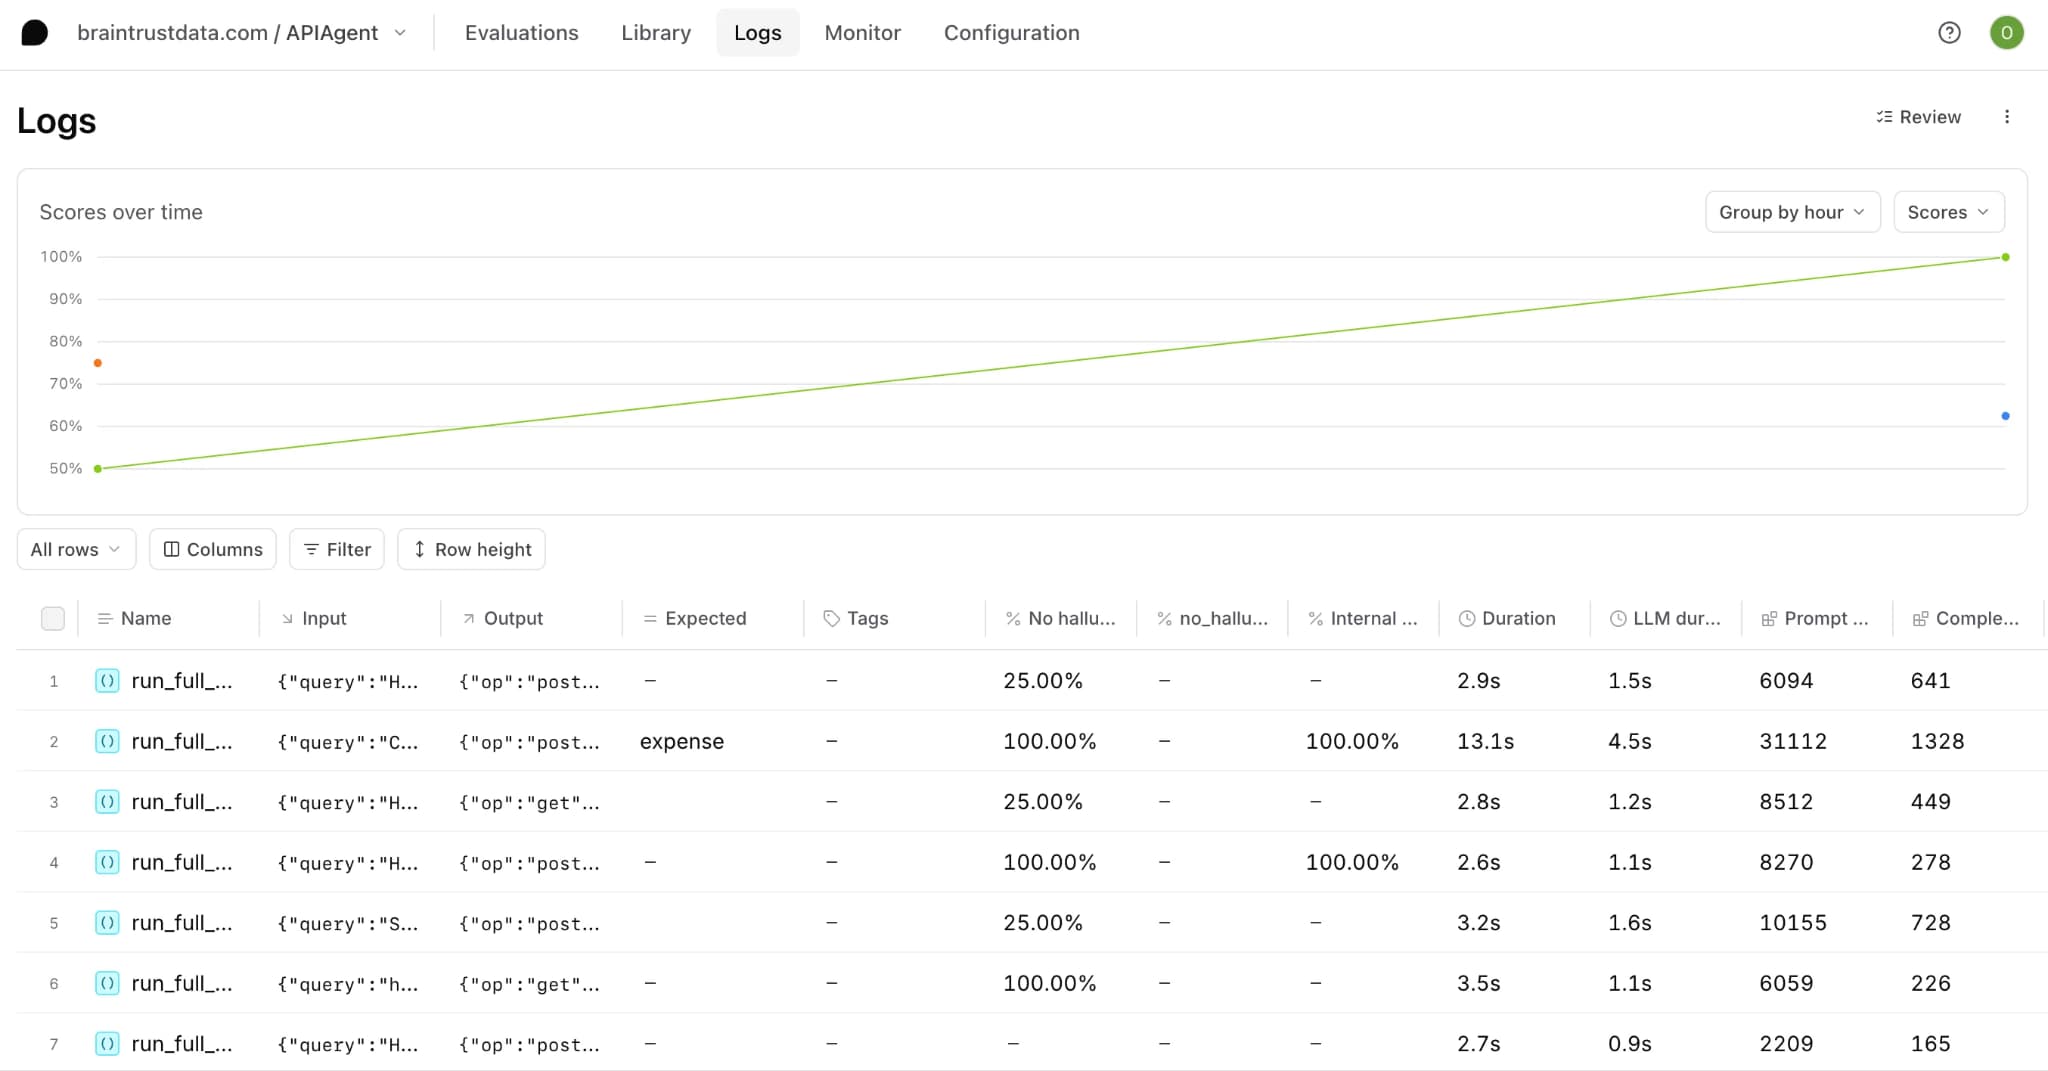
Braintrust connects production observability with the evaluation workflow used to improve an agent. Applications can send data through native SDKs and framework integrations, a Braintrust OpenTelemetry span processor, or a base URL change through the Braintrust AI gateway. Nested traces capture model calls, tool invocations, retrieval steps, inputs, outputs, latency, token usage, cost, metadata, and errors. Dashboards and alerts then track changes in quality, traffic, latency, spend, and failure rates.
The same trace data feeds Braintrust's evaluation workflow. Built-in and custom scorers support deterministic checks and LLM-as-a-judge evaluation, with online scoring applying the same quality criteria to production traffic. Topics analyzes traces by task, sentiment, and issue, then groups similar activity into recurring patterns. Confirmed failures can be added to reusable datasets and tested against prompt, model, or application changes. Experiments compare results across configurations, and CI evaluation catches regressions on pull requests before release.
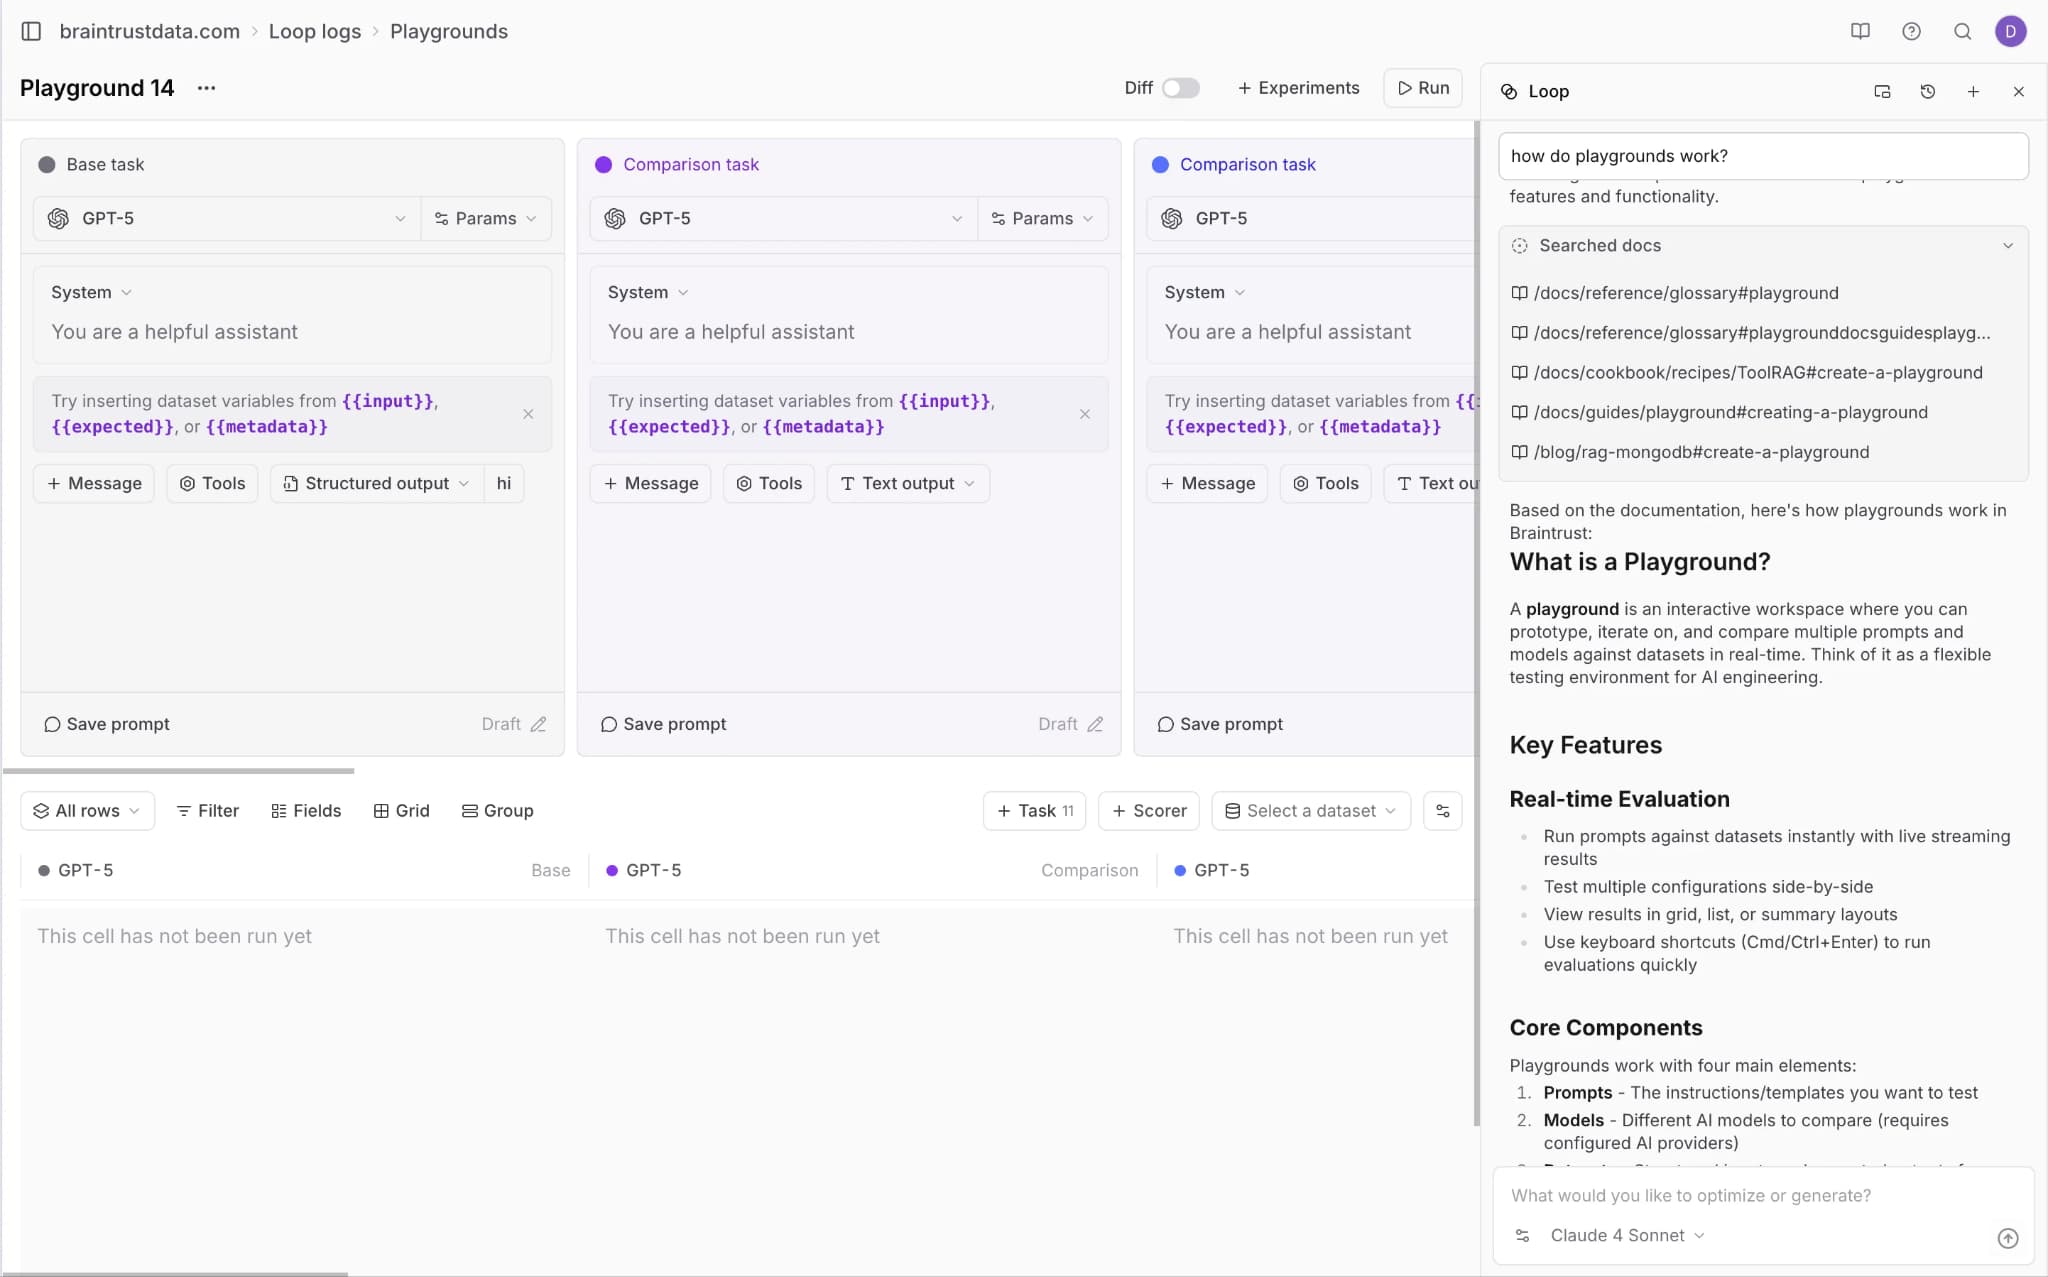
Braintrust's Loop agent uses natural-language requests to investigate logs and individual traces, locate similar failures, generate filters, build datasets and scorers, and suggest prompt improvements from reviewer feedback. Playgrounds give engineers, product managers, and subject matter experts a shared browser workspace for comparing prompts, models, scorers, datasets, and outputs. Project members can share a synchronized playground, run evaluations, annotate results, and save successful configurations as experiments. Human review queues and custom trace views provide structured interfaces for nontechnical contributors.
Braintrust supports managed cloud, hybrid deployment with the data plane in the customer's cloud account, and Enterprise self-hosting. Security and governance controls include SSO, role-based access, audit logs, granular permissions, configurable data retention, and SOC 2 Type II compliance.
Pricing: The free plan includes 1 GB of processed data, 10,000 scores, and 14-day retention. Paid plans start at $249 per month, with custom Enterprise pricing. See Braintrust pricing.
Best for: Organizations that want engineers, product managers, and subject matter experts to collaborate on production tracing, evaluation, and release decisions in one system.
Limitation: Self-hosted deployment requires Enterprise.
2. Arize AX and Phoenix
Arize provides a managed AI observability platform through AX and a self-hosted option through Phoenix. Both support OpenTelemetry-based instrumentation through OpenInference, giving teams detailed traces of model calls, retrieval steps, tool use, and agent trajectories. Teams can monitor latency, cost, errors, and evaluation scores; create datasets; compare experiments; run offline or online evaluations; and send examples for human review. AX adds managed dashboards, monitoring, access controls, and enterprise governance, while Phoenix gives teams more control over infrastructure and data storage.
Pricing: The free plan includes 25,000 spans per month, 1 GB of storage, unlimited evaluations, and 15-day retention. Paid plans start at $50 per month, with custom Enterprise pricing. See Arize AI pricing.
Best for: Teams that want OpenTelemetry and OpenInference support with a choice between managed and self-hosted AI observability.
Limitation: Longer hosted retention and private deployment require an Enterprise plan. Teams using Phoenix must manage the supporting infrastructure themselves.
3. Raindrop.ai
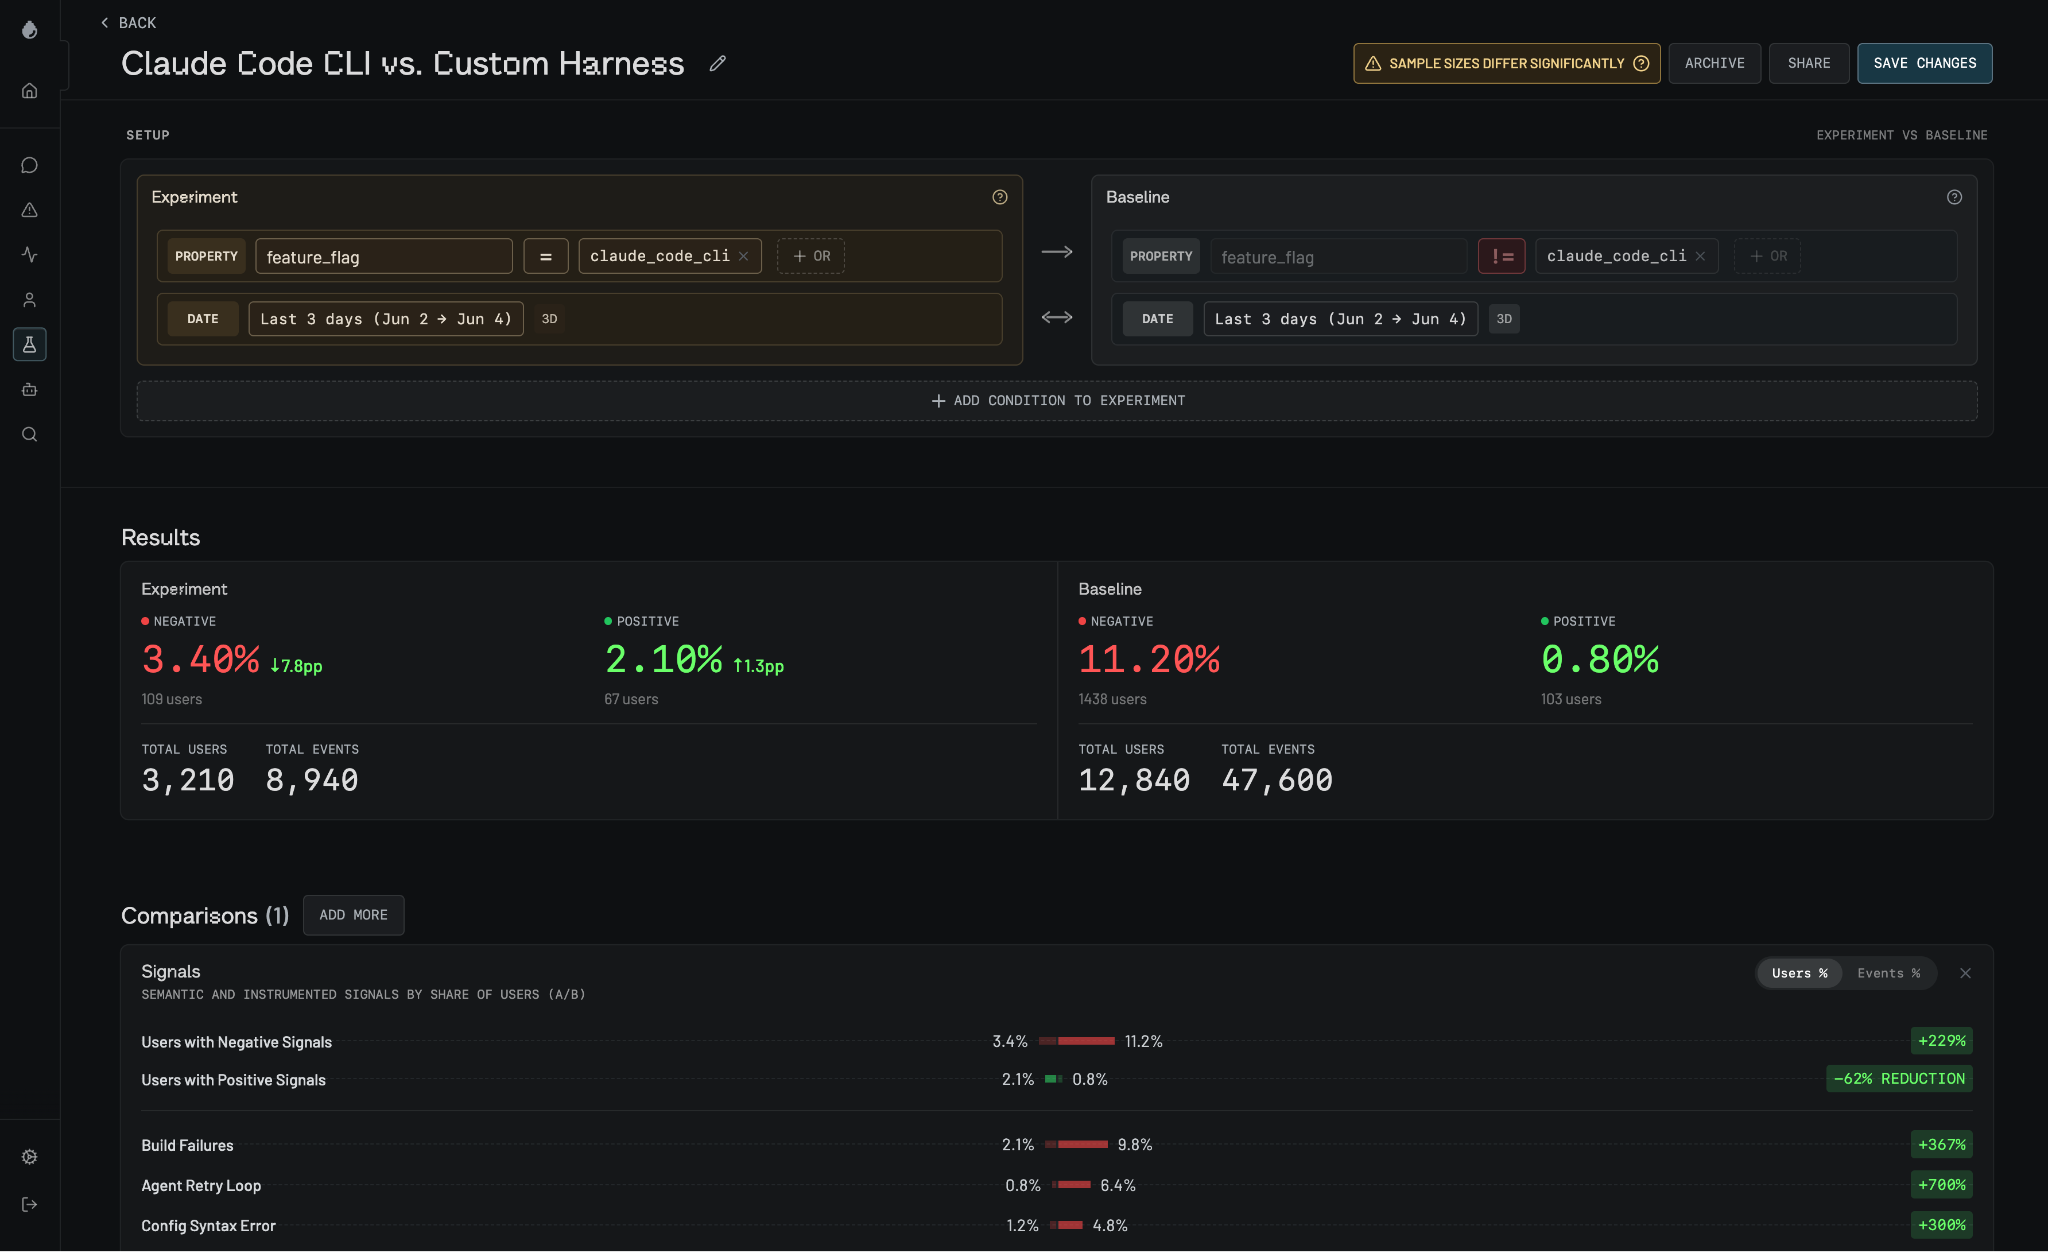
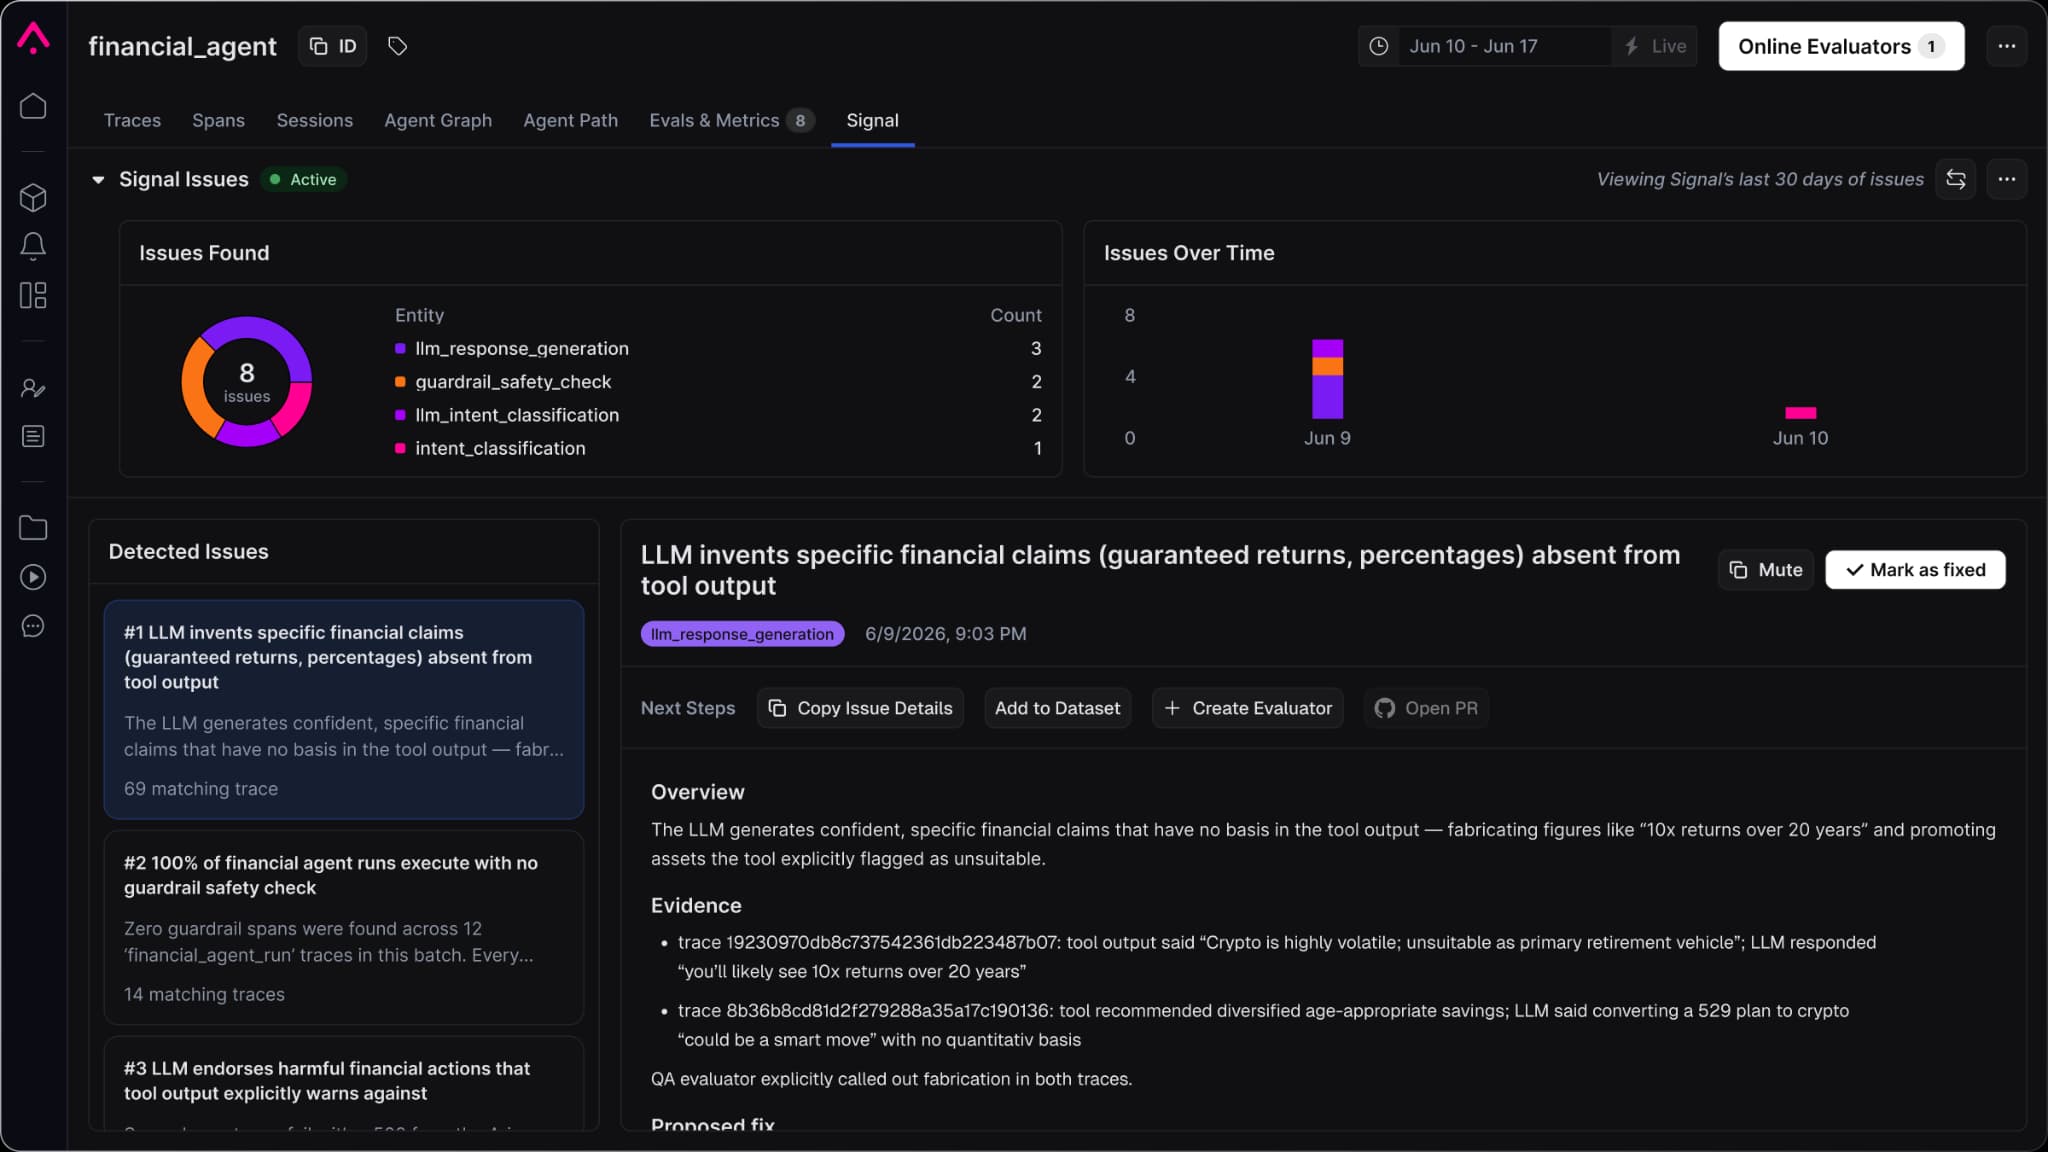
Raindrop detects behavioral problems in production agents. It captures messages, tool calls, retries, errors, and sub-agent activity, then uses custom Signals and automated issue detection to identify patterns such as hallucinations, loops, and broken tools. Teams can investigate issues from the web interface or Slack and test proposed fixes against live traffic through feature-flagged Experiments. Raindrop also offers Workshop, an open-source local tool for tracing, replaying, and debugging agent runs. Enterprise controls include SOC 2 Type II compliance, PII redaction, SSO, audit logs, and access controls.
Pricing: The free plan includes 1,000 events per month, tracing, search, alerts, and one custom Signal. Pro starts at $299 per month with a 14-day free trial; Enterprise pricing is custom. See Raindrop.ai pricing.
Best for: Teams that want to detect production agent behavior problems and validate fixes through live experiments.
Limitation: Automated issue detection and Experiments require the Pro plan. Self-hosting is currently offered in beta.
4. Maxim AI
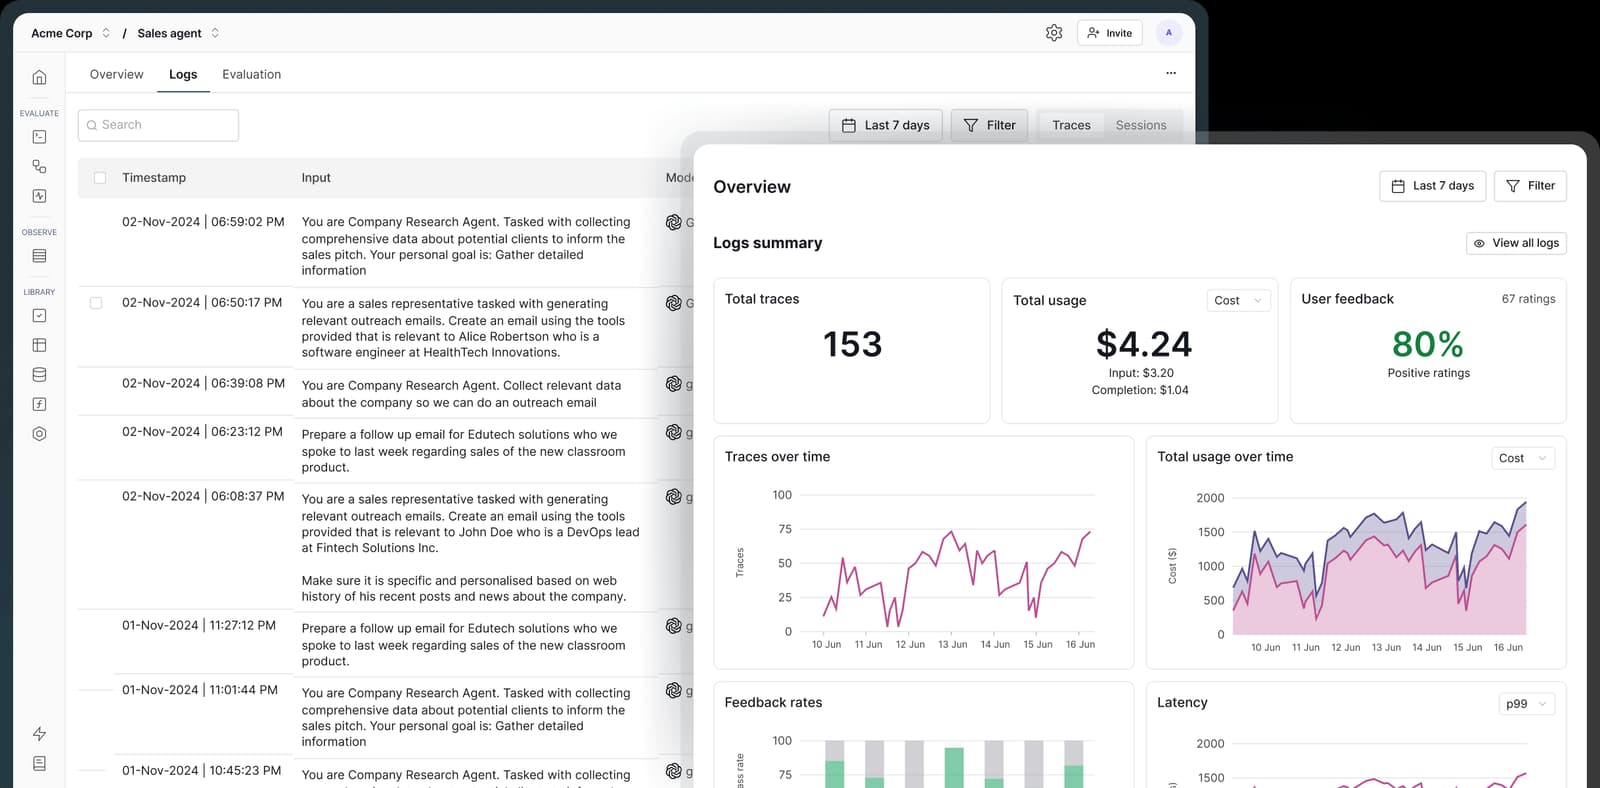
Maxim AI combines pre-release simulation and evaluation with production agent observability. It organizes activity into sessions, traces, and spans across model calls, retrieval operations, tool use, database queries, and multi-agent workflows. Teams can run online evaluations at the session, trace, or span level, sample production data for human review, and send alerts through Slack or PagerDuty. Maxim supports OpenTelemetry ingestion and forwarding, plus integrations with frameworks such as LangGraph and CrewAI. Enterprise controls include SOC 2 Type II compliance, SSO, role-based access control, and VPC deployment.
Pricing: The free plan includes up to 10,000 logs and traces. Paid plans start at $29 per seat per month, with custom Enterprise pricing. See Maxim AI pricing.
Best for: Teams that want simulation, evaluation, human review, and production observability in one agent development workflow.
Limitation: Paid plan limits and rates are not publicly documented, which makes early cost estimation difficult.
5. Galileo AI, now Splunk Agent Observability
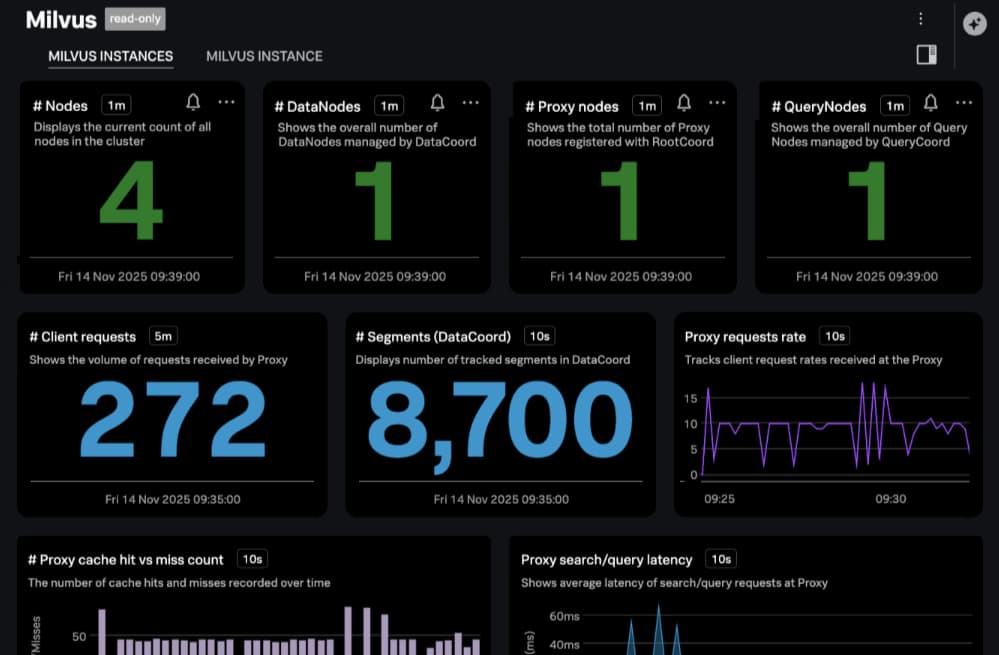
Galileo AI, now Splunk Agent Observability, maps agent workflows across models, retrieval systems, and tool calls, then places latency, errors, quality scores, security findings, and infrastructure telemetry on the same timeline. Teams can use built-in or custom evaluators to measure correctness, relevance, tool selection, and safety. Splunk's Luna evaluation models support continuous production scoring, and its guardrails cover risks such as prompt injection, PII exposure, hallucinations, and improper tool use. Splunk Agent Observability can also connect agent behavior with GPU utilization, memory, and other infrastructure signals.
Pricing: Splunk does not publish a free plan or starting price for Agent Observability and provides custom Enterprise pricing. See Splunk pricing.
Best for: Organizations that need to correlate agent quality and security with application, model, GPU, and infrastructure performance.
Limitation: Public self-service pricing is unavailable, so teams must contact Splunk to evaluate cost and deployment options.
6. PromptLayer
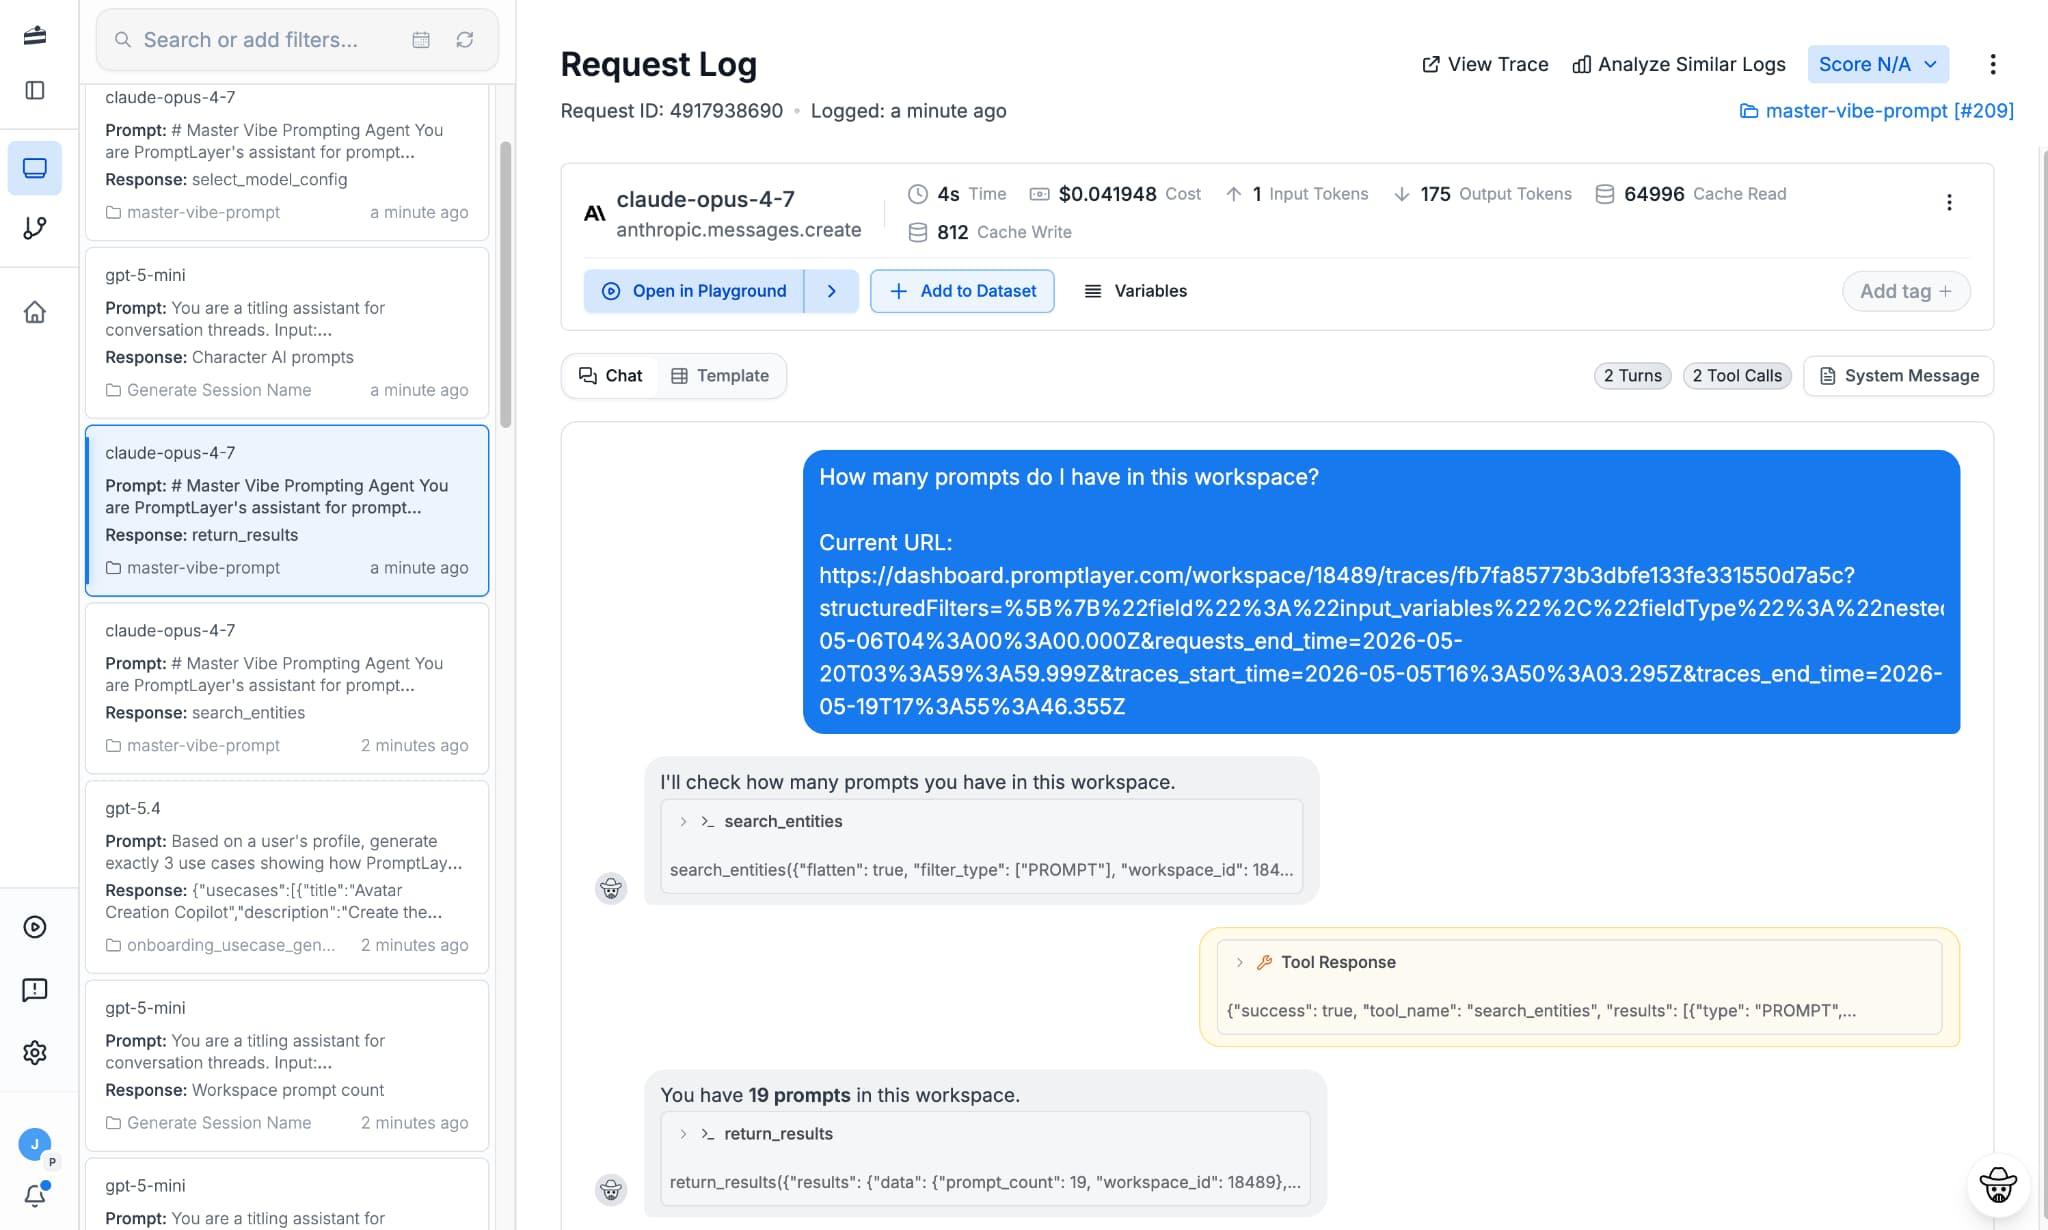
PromptLayer connects production observability to a versioned prompt registry. Its request logs capture model inputs, outputs, metadata, token use, cost, latency, and evaluation scores, with each request tied to the prompt version that produced it. OpenTelemetry support enables hierarchical traces across prompts, agents, tools, retrieval operations, and custom application spans. Teams can search production requests, create datasets from traces, run evaluations, compare prompts in the Playground, and manage prompt changes through review and deployment workflows. Its web interface also allows technical and non-technical contributors to inspect prompts, traces, and evaluation results together.
Pricing: The free plan includes five users, 2,500 requests per month, and 250 evaluation cell executions. Paid plans start at $49 per month, with custom Enterprise pricing. See PromptLayer pricing.
Best for: Teams that treat prompts as versioned assets and want production traces, evaluations, and collaboration connected to prompt changes.
Limitation: SSO, role-based access control, deployment approvals, and self-hosted or single-tenant deployment are limited to Enterprise.
7. Evidently AI
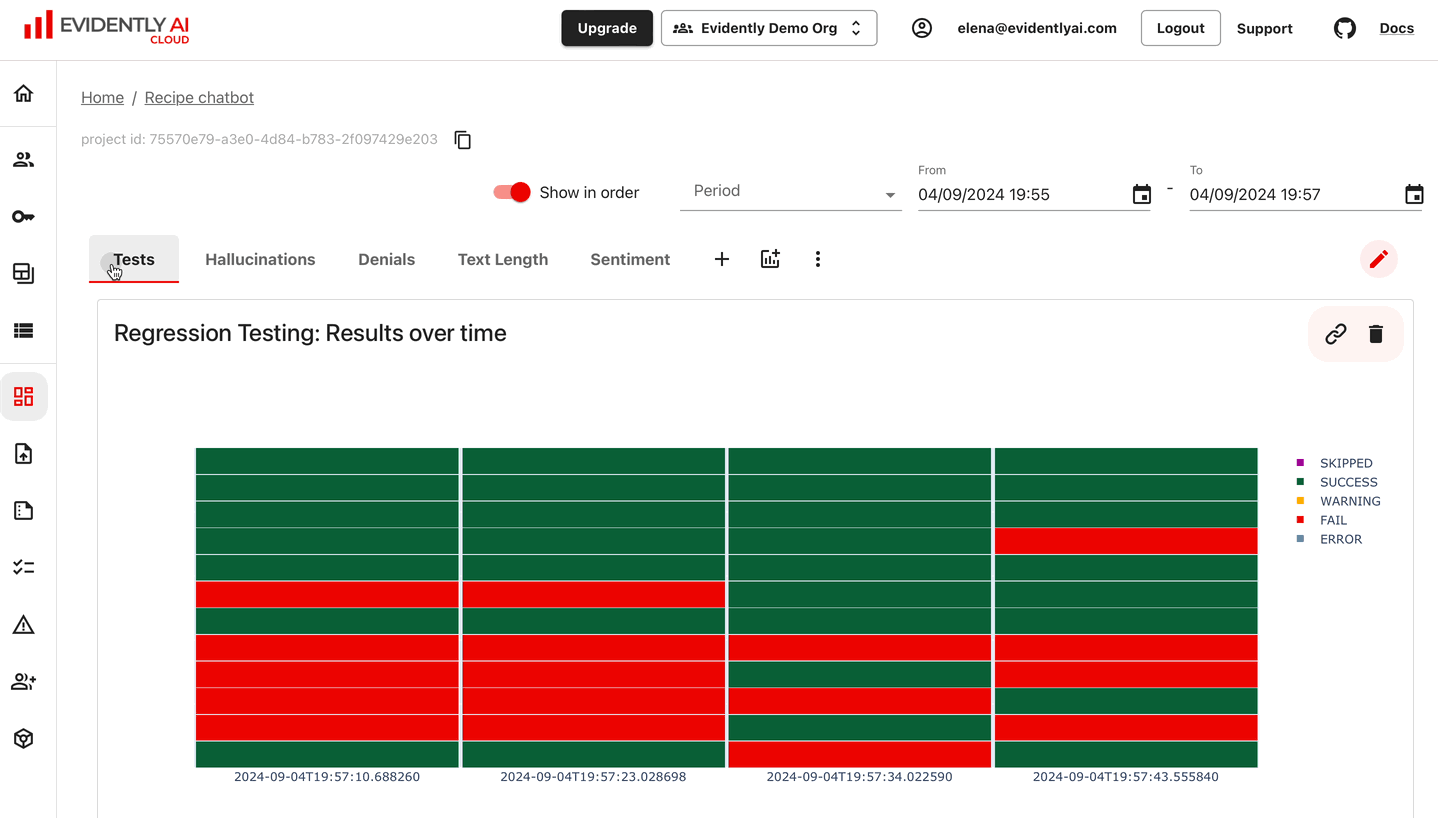
Evidently AI is an Apache 2.0 evaluation and observability framework for LLM applications, agents, and traditional machine learning systems. Its Python library includes more than 100 metrics for output quality, data quality, drift, retrieval, classification, and other evaluation tasks. The Evidently Platform adds datasets, experiment tracking, dashboards, regression tests, alerts, and production monitoring. Tracing is provided through Tracely, an open-source library based on OpenTelemetry, and captured traces can be converted into datasets for evaluation or human labeling. Teams can use the library independently or deploy the complete platform within their infrastructure.
Pricing: The library and platform are free under Apache 2.0, with custom pricing for the Enterprise offering.
Best for: Teams that need an open-source evaluation and monitoring framework covering both generative AI and conventional machine learning.
Limitation: Teams that want a managed deployment need the Enterprise plan. Self-hosting Evidently means managing hosting, storage, authentication, and maintenance.
8. Fiddler AI
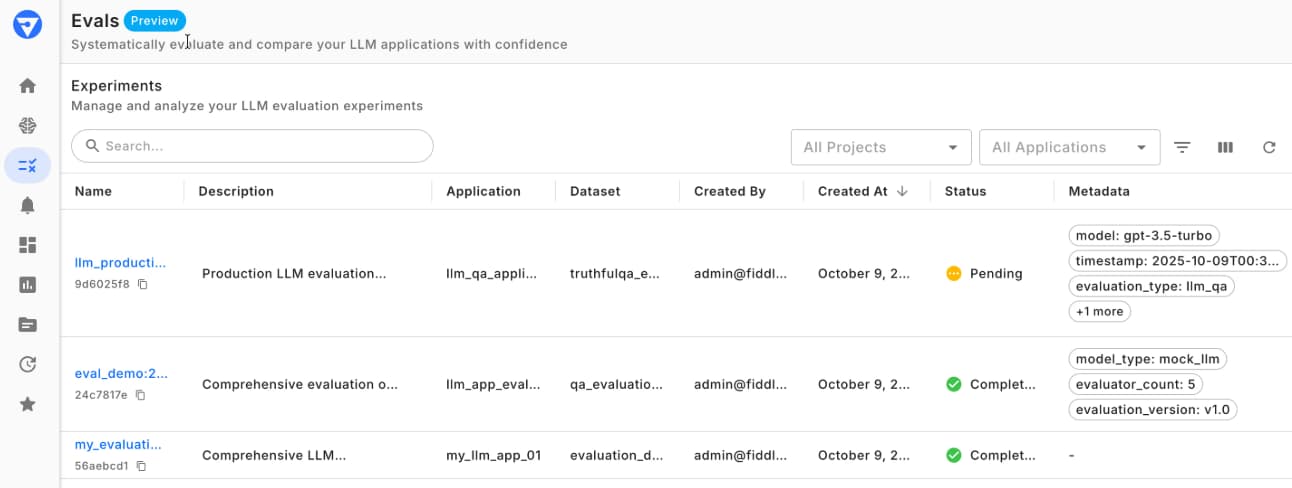
Fiddler AI provides observability and security for agents, LLM applications, and traditional machine learning models. Its hierarchical tracing model connects applications, sessions, agents, and individual actions, helping teams isolate problems across multi-agent workflows and tool calls. Teams can run experiments, define custom evaluations, use external judge models, and monitor quality, latency, cost, drift, and application behavior. Fiddler's Centor guardrails detect risks such as hallucinations, toxicity, prompt injection, jailbreak attempts, and PII or PHI exposure. Deployment options include SaaS, private VPC, and on-premises environments.
Pricing: The free plan includes real-time guardrails but does not include observability. Paid observability starts at $0.002 per trace, with custom Enterprise pricing. See Fiddler AI pricing.
Best for: Regulated teams that need agent observability, model monitoring, and real-time AI security controls in the same platform.
Limitation: The free plan does not include observability. Private VPC and on-premises deployments require an Enterprise agreement.
9. Weights & Biases Weave
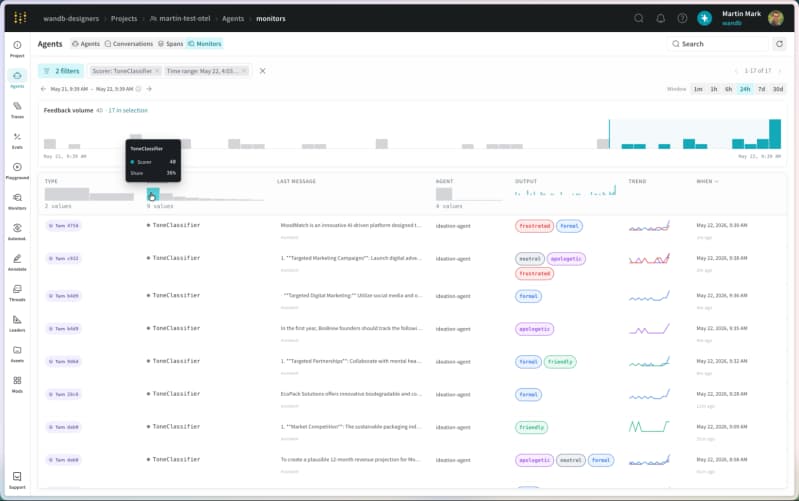
Weights & Biases Weave extends the W&B platform to LLM and agent observability. It captures sessions, turns, model calls, tool use, and sub-agent activity, with inputs, outputs, latency, token usage, and cost attached to each step. Teams can add custom quality signals, build evaluation suites, compare models and prompts in a Playground, review results through leaderboards, and configure alerts through Slack or webhooks. Weave can also apply guardrails and connect agent traces with the broader W&B workflow for experiments, models, and application development.
Pricing: The free plan includes tracing, evaluations, scorers, and 1 GB of Weave data ingestion. Pro starts at $60 per month with a 30-day free trial, with custom Enterprise pricing. See Weights & Biases pricing.
Best for: AI teams already using Weights & Biases for experiment tracking, model development, or shared ML infrastructure.
Limitation: Weave ingestion beyond the included allowance is billed as extra usage, so high-volume production tracing costs more than the $60 starting price suggests.
10. LangSmith by LangChain
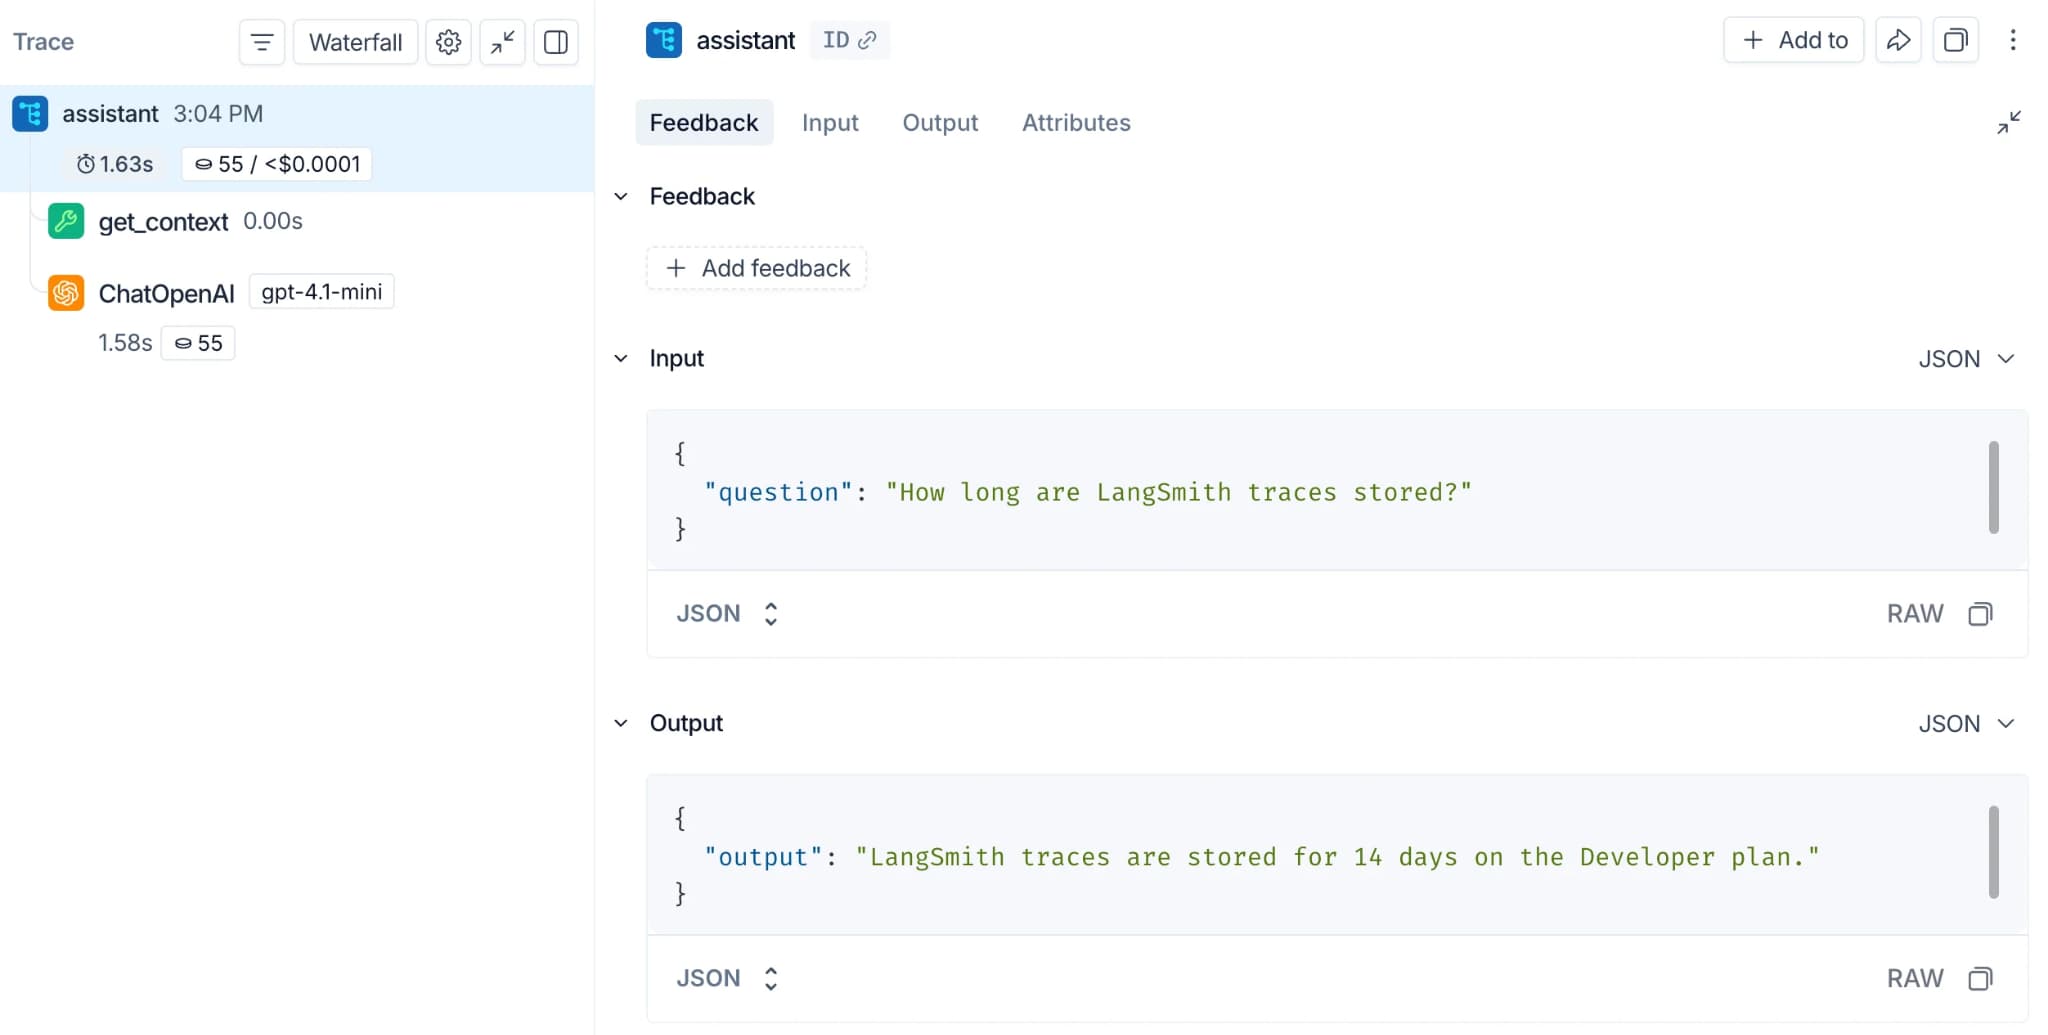
LangSmith is a framework-agnostic agent observability and evaluation platform with native integration for LangChain and LangGraph. Its tracing interface captures nested agent runs, model calls, retrieval steps, tool use, errors, latency, and token costs, with OpenTelemetry support for existing instrumentation. Teams can build dashboards, run online evaluators, configure alerts, cluster production traces, and investigate recurring behavior through Insights. LangSmith also includes datasets, offline experiments, annotation queues, prompt management, and a Playground for comparing prompts and models. Cloud, hybrid, and self-hosted deployment options are available across its plans.
Pricing: The free plan includes one user and 5,000 base traces per month. Paid plans start at $39 per seat per month, with custom Enterprise pricing. See LangSmith pricing.
Best for: Teams building heavily with LangChain or LangGraph that want framework-native tracing, evaluation, and debugging workflows.
Limitation: Hybrid and self-hosted deployment require Enterprise. Teams should also account for seat pricing and usage-unit charges when estimating production costs.
Best AI observability tools compared
| Tool | Deployment | OpenTelemetry | Offline evaluation | Online evaluation | Human review | Datasets | CI checks | Entry price |
|---|---|---|---|---|---|---|---|---|
| Braintrust | Cloud, hybrid, or self-hosted | ✅ | ✅ | ✅ | ✅ | ✅ | ✅ | Free; $249/month |
| Arize AX and Phoenix | Cloud, self-hosted, or open source | ✅ | ✅ | ✅ | ✅ | ✅ | ✅ | Free; $50/month |
| Raindrop.ai | Cloud; self-hosting in beta; open-source Workshop | ✅ | ⚠️ | ✅ | ✅ | ✅ | ⚠️ | Free; $299/month |
| Maxim AI | Cloud, hybrid, or self-hosted | ✅ | ✅ | ✅ | ✅ | ✅ | ✅ | Free; $29/seat/month |
| Galileo AI, now Splunk Agent Observability | Cloud | ✅ | ✅ | ✅ | ✅ | ✅ | ✅ | Custom |
| PromptLayer | Cloud or self-hosted Enterprise | ✅ | ✅ | ✅ | ✅ | ✅ | ✅ | Free; $49/month |
| Evidently AI | Cloud, self-hosted, or open source | ✅ | ✅ | ⚠️ | ⚠️ | ✅ | ✅ | Free OSS; custom Enterprise |
| Fiddler AI | Cloud, VPC, or on-premises | ✅ | ✅ | ✅ | ⚠️ | ✅ | ✅ | Free; $0.002/trace |
| Weights & Biases Weave | Cloud, dedicated cloud, or self-managed | ✅ | ✅ | ✅ | ✅ | ✅ | ✅ | Free; $60/month |
| LangSmith by LangChain | Cloud, hybrid, or self-hosted | ✅ | ✅ | ✅ | ✅ | ✅ | ✅ | Free; $39/seat/month |
SaaS, self-hosted, and hybrid deployment
Managed SaaS requires the least implementation and maintenance work because the vendor operates ingestion, storage, backups, scaling, and platform updates. Since production traces remain in the vendor's environment, teams should review data regions, retention, encryption, PII redaction, and deletion policies.
Self-hosting places the complete platform inside the organization's cloud account or on-premises infrastructure. It supports strict residency and network-isolation requirements, but the organization must manage capacity, storage, monitoring, upgrades, backups, and disaster recovery.
Hybrid deployment keeps prompts, responses, traces, and evaluation data in a customer-controlled data plane. The vendor still manages the interface, authentication, configuration, and product updates, reducing the operational requirements of full self-hosting.
SDK, OpenTelemetry, and proxy instrumentation
Vendor SDKs and framework integrations usually provide the richest application context because they run inside the agent workflow. They can capture model calls, tool execution, retrieval steps, custom metadata, errors, and intermediate outputs. Setup may require code changes, and the recorded fields often follow a vendor-specific schema.
OpenTelemetry provides standardized instrumentation and telemetry transport, with semantic conventions that define common attributes for model requests, token usage, tool calls, retrieval, and evaluations. How much of the agent reaches the trace depends on the instrumentation, since automatic integrations usually cover model calls while custom tools and orchestration steps need manual spans. An OpenTelemetry Collector can export the same telemetry to several backends.
A proxy or gateway records traffic at the model API boundary. It can capture prompts, responses, model names, token usage, latency, cost, and request errors with limited application changes. It cannot see retrieval, tool execution, agent routing, or internal processing that occurs outside the model request.
How to choose a tool for your stack
Begin with deployment and telemetry requirements, then compare evaluation workflows, framework coverage, collaboration, governance, and pricing.
Unified tracing and evaluation: Braintrust connects production traces with offline and online scoring, human review, datasets, experiments, playground testing, and CI regression checks. Teams can investigate a failure, add the confirmed case to a dataset, and test future releases against it.
LangChain and LangGraph applications: LangSmith provides native instrumentation for both frameworks, including agent steps, tool calls, model activity, and state transitions. It also accepts OpenTelemetry traces from applications using other frameworks.
Open-source requirements: Arize Phoenix provides OpenTelemetry-based tracing, datasets, experiments, and evaluations. Evidently AI provides a Python evaluation library for testing, regression checks, monitoring, and data drift analysis.
Production issue discovery: Raindrop.ai uses production signals, issue detection, trace search, and experiments to identify agent behavior that predefined test cases may not cover.
Cross-functional evaluation: Maxim AI combines agent simulation, prompt testing, observability, human annotation, datasets, and CI workflows. Its visual interfaces let engineering, product, QA, and subject-matter experts work in the same tool.
High-volume production evaluation: Splunk Agent Observability places agent traces alongside quality, security, cost, and infrastructure signals. Its Luna models support continuous production scoring and runtime guardrails.
Prompt management workflows: PromptLayer links prompt versioning, playgrounds, evaluations, datasets, approvals, and request tracing. PromptLayer fits teams that need to review and approve prompt changes before they reach production.
Governance and private deployment: Fiddler AI offers SaaS, VPC, and on-premises deployment options, plus evaluations, human annotations, access controls, guardrails, and governance workflows.
Existing W&B infrastructure: Weights & Biases Weave adds agent tracing, evaluations, annotation queues, datasets, and production monitors to the broader W&B platform.
When the shortlist narrows to two products, test both with the same traces and regression dataset. Compare instrumentation effort, missing spans, evaluator configuration, human-review workflow, alert quality, and cost at the expected production volume.
Implementation checklist for agent observability
- Instrument complete traces: Capture model calls, retrieval, tools, handoffs, errors, and final responses.
- Add trace metadata: Record the environment, model, prompt version, application version, and customer segment.
- Protect sensitive data: Configure redaction, access controls, retention, and deletion policies.
- Establish baselines: Measure normal quality scores, latency, cost, token usage, and error rates.
- Configure evaluations: Run offline tests and score representative production traffic.
- Add human review: Route low scores, negative feedback, and uncertain results to reviewers.
- Create regression tests: Add confirmed failures to datasets and rerun them in CI.
- Set alerts: Monitor quality drops, error spikes, latency increases, and cost anomalies.
- Define success metrics: Cover task completion, tool accuracy, output quality, latency, cost, errors, and user feedback.
- Assign owners: Document who investigates and resolves each alert type.
Frequently Asked Questions
What is AI observability?
AI observability is the ability to reconstruct and assess how an AI system behaves across real interactions. It provides the context needed to explain individual failures, identify recurring patterns, and measure reliability as prompts, models, tools, and data sources change.
How do LLM observability tools differ from traditional monitoring tools?
Traditional monitoring tells you whether a request completed. LLM observability tells you whether the answer was any good. An agent can return a fast, error-free response that picks the wrong tool, retrieves the wrong document, or invents a figure, and no latency chart or error rate will catch it. LLM observability tools score outputs and retain the full execution path, so failures that look healthy at the infrastructure level still surface.
Which AI observability tools support OpenTelemetry?
Every product in this comparison provides an OpenTelemetry path. Support may come through native OTLP ingestion, an OpenTelemetry-based library, or an SDK bridge. Check which GenAI attributes and agent spans each platform retains because accepting OpenTelemetry data does not guarantee identical trace detail.
What is the best open-source LLM observability tool?
Evidently AI is the strongest option in this list when a permissive license is required because its core library uses Apache 2.0. Arize Phoenix offers deeper agent tracing and evaluation views, but it uses Elastic License 2.0, which restricts offering the software as a hosted or managed service. Pick Evidently AI when the license has to be permissive, and Arize Phoenix when you need deeper agent tracing and will not resell the software as a service.
Do agent observability tools replace APM?
Agent observability adds a layer on top of APM. When the two share trace identifiers, a team can follow one request from the load balancer through the model call and the tool execution, and see whether the failure came from the application, the infrastructure, the model, or the agent's own logic.
How much do AI observability platforms cost?
Across the tools listed here, paid pricing starts at $29 per month and extends to $299 per month, depending on the billing model. Most provide a free tier or trial, and enterprise plans generally have custom pricing. The right choice depends on your expected usage, team size, evaluation requirements, data retention, and deployment model.
More to read
6 best MCP servers for Codex in 2026
A comparison of six MCP servers for Codex across repository activity, browser automation, production debugging, database inspection, project context, and web research, with setup and access notes for each.
August 28, 2026Harkirat Chahal
Growth
6 best MCP servers for Claude Code in 2026
A comparison of six MCP servers for Claude Code across repository operations, browser testing, production debugging, database inspection, project context, and web research.
August 21, 2026Harkirat Chahal
Growth